Reports & money
 123
123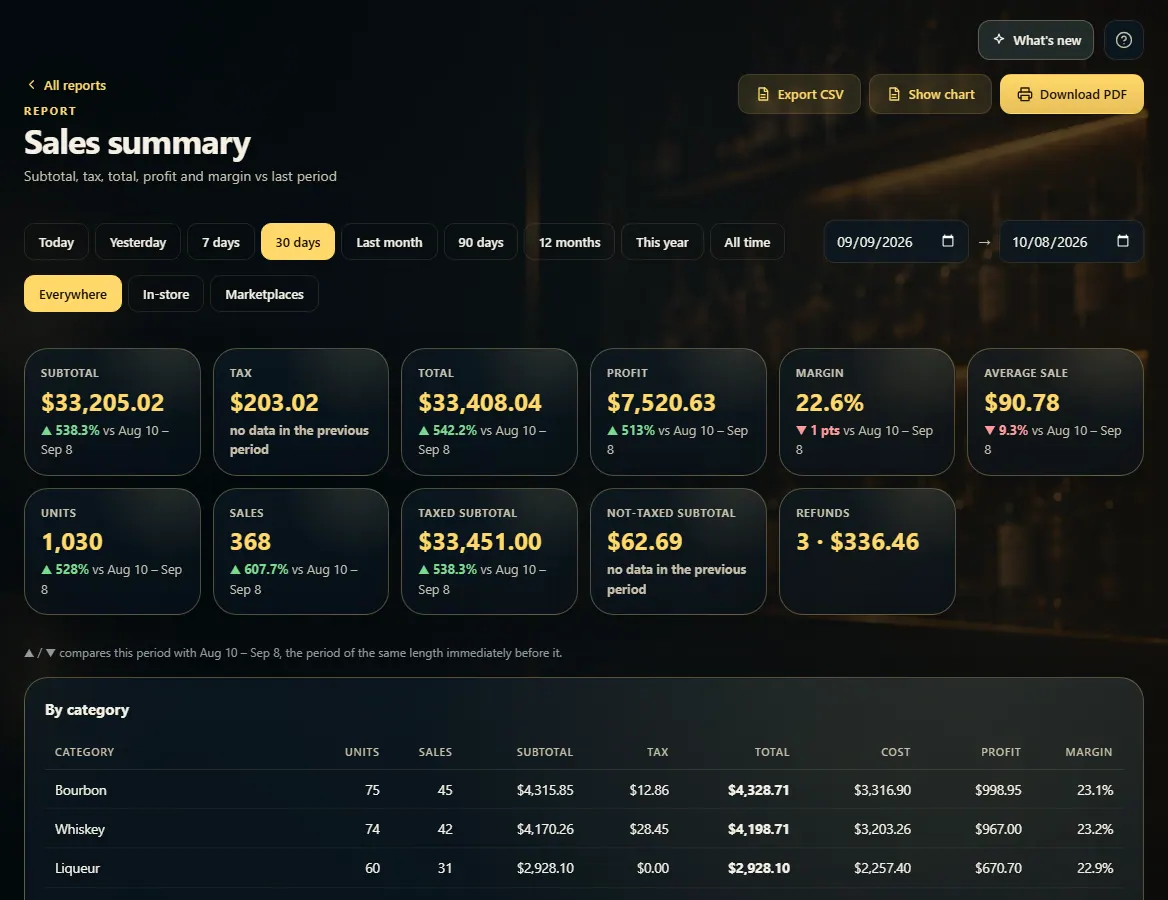 1234
1234
Run a report
Reports has sales, tax, accounting, inventory, cash and labor reports — pick one, set the dates, and export it to CSV or PDF.
Steps
- Open Reports from the menu (under Records).
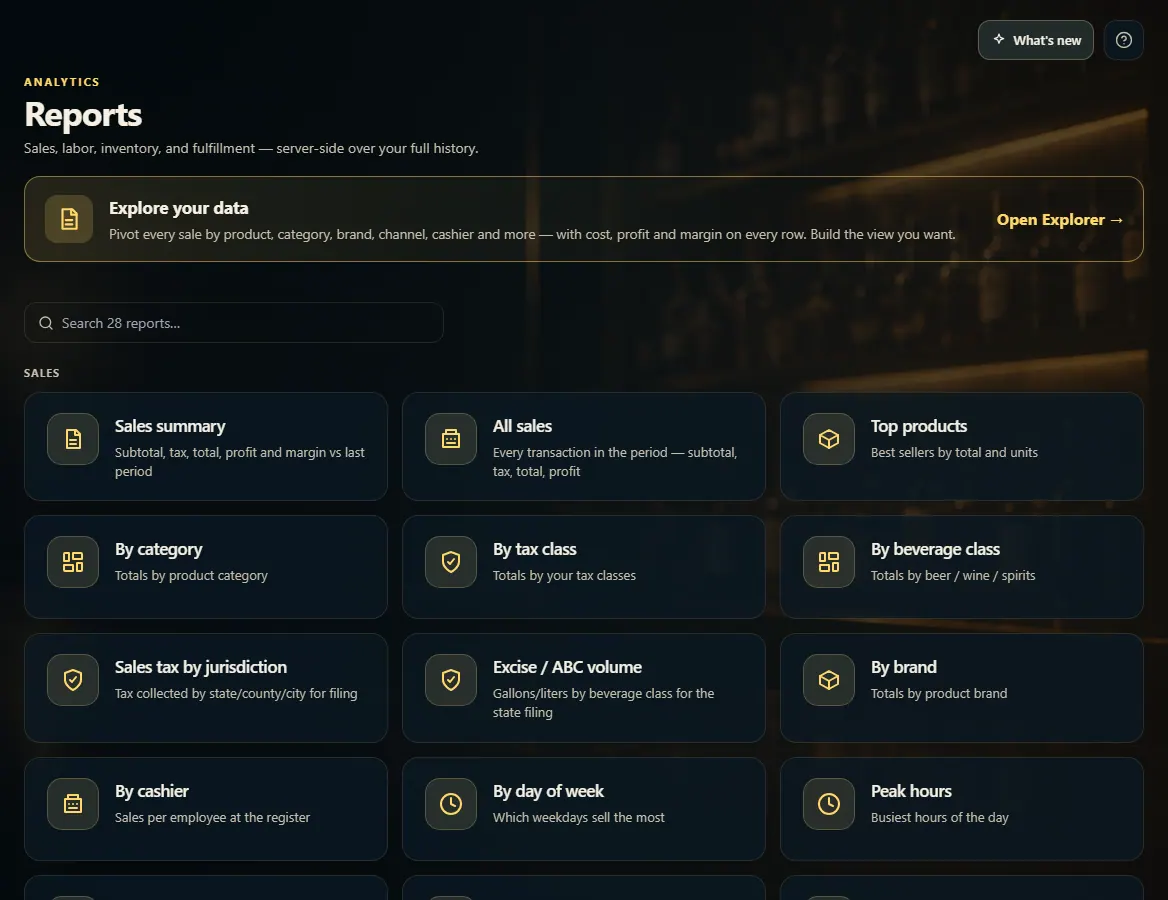
- Click a report card, or type in the Search box to find one.
- Pick a date range — Today through All time — or type your own dates.
- On sales reports, choose Everywhere, In-store or Marketplaces.
- Click Export CSV for a spreadsheet, or Download PDF for a printable copy.
- Click All reports to go back to the list.
Good to know
- Sales: Sales summary, All sales, Top products, By category, By tax class, By beverage class, Sales tax by jurisdiction, Excise / ABC volume, By brand, By cashier, By day of week, Peak hours, Units per sale, Product margin, Refunds & voids.
- Accounting: Sales tax, and Accounting summary (with QuickBooks Desktop, QuickBooks Online and Xero files). Inventory: Stock valuation, Reorder suggestions, Negative inventory, Losses & shrink, Stock movements, Item margins. Cash: Closing counts, Register over/short, Adds & payouts. Labor: Employee hours, Clock entries.
- Explore your data, at the top, lets you group every sale by product, category, brand, cashier, day and more, and save the view as your own report.
- Reports about cost, margin and profit only appear for people whose role can see product costs.
- Stock reports show stock right now, so they have no date range.
1. Pick a report
Reports are grouped into Sales, Accounting, Inventory, Cash and Labor. Search narrows the list; Explore your data builds your own view.
123- 1Build your own view of every sale.
- 2Search the reports.
- 3Click a report to open it.
2. Set the dates and export
Pick a range and the report recalculates over your full history. Export CSV or Download PDF takes the same numbers with you.
1234- 1Pick a date range, or type your own dates.
- 2Everywhere, In-store, or Marketplaces.
- 3Download a spreadsheet.
- 4Download a printable PDF.